How to use Empirical Rule Calculator?
- Enter the Mean (μ) and Standard Deviation (σ) of your dataset
- Click the “Calculate” button to see the Answer (distribution intervals), and Solution
Note: Empirical Rule calculator operates under the assumption of a normal distribution for the dataset and not applicable to non-normal distributions. The analysis of data should not solely rely on it, although it may provide useful insights.
This calculator is used to find the ranges that are 1 standard deviation, 2 standard deviations, and 3 standard deviations. It helps you find 68, 95, and 99.7% of the normally distributed data respectively. It is recommended as a tool for checking your calculations and supplementing your understanding of data distribution. For example, it can help you quickly calculate measures of central tendency, such as the mean or median, which can give you a better understanding of how the data is distributed. This can be especially helpful when dealing with large datasets or complex calculations.
What is the Empirical Rule?
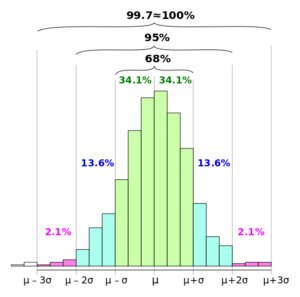
The Empirical Rule, also known as the 68-95-99.7 rule or 3-sigma rule, is a fundamental principle in statistics that describes the typical distribution of data in a normal distribution curve. It states that:
- 68% of the data falls within one standard deviation of the mean
- 95% of the data falls within two standard deviations of the mean
- 99.7% of the data falls within three standard deviations of the mean
Empirical Rule calculator also allows you to plot the distribution of your data as a bell curve, which makes it easier to understand the data. A bell curve is a statistical distribution that shows the probability of a certain event occurring. Here standard deviation is a measure of spread and you get an idea on how diverse the dataset is. Take the reference of below standard deviation graph to understand visually.
Empirical Rule Calculation Explanation with Formula
Empirical Rule Calculator simplifies the process of understanding and applying this rule. By entering your dataset; the mean, and standard deviation, you’ll get the solution according to the distribution intervals.
Formula
- μ-σ and μ+σ for one standard deviation of the mean
- μ-2σ and μ+2σ for two standard deviation of the mean
- μ-3σ and μ+3σ for three standard deviation of the mean
Interpreting Results from Empirical Rule
Understanding statistics and the Empirical Rule is essential for effectively using the calculator and understanding the results. Assume that any restaurant has a mean delivery time of 30 minutes and a standard deviation of 5 minutes, and the data follow the normal distribution. Now let’s calculate:
Mean μ=30 and Standard deviation σ=5
According to the formula
- μ-σ=25 and μ+σ=35 (68% of delivery times occur by 25-35 minutes range)
- μ-2σ=20 and μ+2σ=40 (95% of delivery times occur by 20-40 minutes range)
- μ-3σ=15 and μ+3σ=45 (99.7% of delivery times occur by 15-45 minutes range)
Where is the Empirical Rule Used?
The Empirical Rule finds applications across various fields, including finance, quality control, healthcare, and more. Understanding this rule empowers professionals to identify trends, detect anomalies, and make predictions with confidence. Data analysis and predictions based on distribution are often performed with empirical rule calculator in social sciences, economics, and business. Also, in manufacturing and quality control, it’s used to evaluate a company’s accuracy and variability.